A Guide to Charting and Technical Analysis for Investors and Traders
In the dynamic world of finance, investors and traders employ various tools and strategies to navigate the markets and make informed decisions. Among these, charting and technical analysis stand out as powerful techniques for understanding price movements and identifying potential trading opportunities. In this comprehensive guide, we'll explore the fundamentals of charting and technical analysis, and how you can easily utilize these tools through the Trading View platform.
Understanding Charting and Technical Analysis
Charting: involves visually representing historical price data on graphs to identify patterns and trends. Common types of charts include line charts, bar charts, and candlestick charts. By analyzing price movements over time, chartists aim to identify patterns that may indicate potential future price movements.
Technical Analysis is a method of evaluating securities based on statistical analysis of historical price and volume data. It involves using various technical indicators and chart patterns to forecast future price movements. Technical analysts believe that historical price data, along with market psychology, can help predict future price trends.
Key Tools (we use) in Technical Analysis
Relative Strength Index (RSI)
RSI is a momentum oscillator that measures the speed and change of price movements. It oscillates between 0 and 100 and is used to identify overbought or oversold conditions in a security
Supertrend
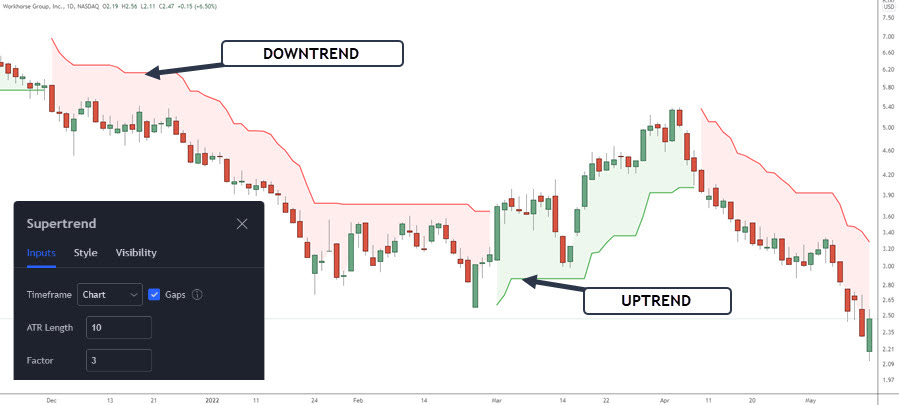
Super trend is a trend-following indicator that helps identify the direction of the prevailing trend. It consists of two components: the trend direction (upward or downward) and the volatility (ATR multiplier). Supertrend can be used to generate buy or sell signals based on trend changes.
Volatility Stop (VStop)
VStop is a trailing stop-loss indicator that adjusts dynamically based on market volatility. It calculates the stop-loss level by multiplying the Average True Range (ATR) by a specified factor. VStop helps traders manage risk by adjusting the stop-loss level according to market conditions (read more on investopedia)
Using Trading View for Charting and Technical Analysis
Trading View is a popular platform that provides advanced charting tools and technical analysis features for traders and investors. With TradingView, users can access a wide range of technical indicators, drawing tools, and charting options to analyze markets across various asset classes.
In the video below we walk you through setting up these indicators and explain which combination you should use for Investing and Trading
Keep reading with a 7-day free trial
Subscribe to Craving Alpha to keep reading this post and get 7 days of free access to the full post archives.


