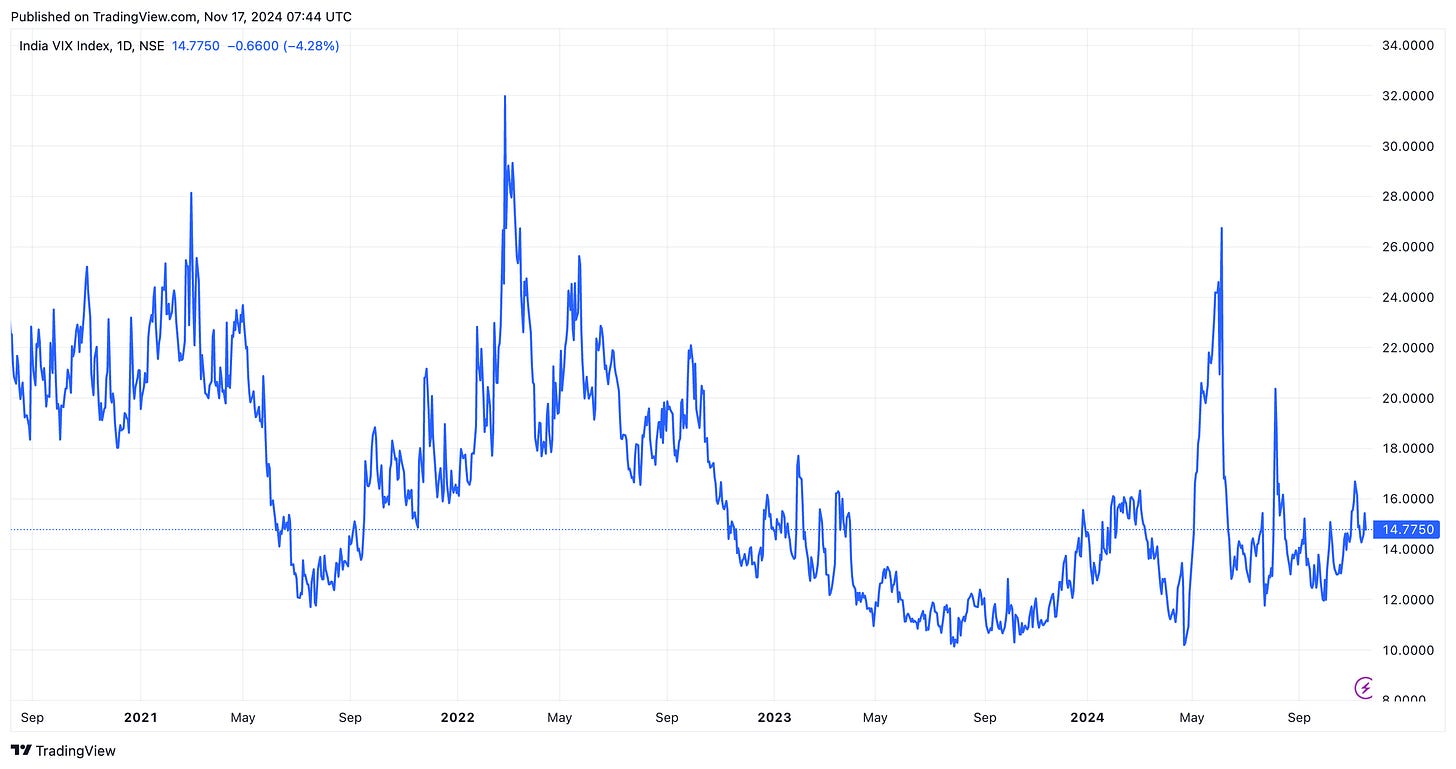
The VIX, known as the “fear gauge,” offers essential insights into market sentiment, reflecting the degree of volatility that investors expect in the S&P 500 over the next 30 days. Traditionally, a high VIX signals market uncertainty or fear, while a low VIX suggests stability and confidence. However, the VIX’s meaning isn’t as straightforward as simply labeling it “fear” versus “greed” — especially in different market conditions
When investors are highly concerned about a possible market downturn, the VIX tends to spike, indicating an increase in hedging activities like buying put options. But in calmer conditions, when investors are less fearful, the VIX declines. This doesn’t mean, however, that a low VIX always reflects “complacency.” Instead, the interpretation of the VIX changes depending on the broader market trend, whether it’s an uptrend (bull market) or a downtrend (bear market). This context makes it an effective gauge of sentiment, allowing investors to interpret subtle signs about market confidence, fatigue, or looming reversals.
Understanding how the VIX behaves in both bull and bear markets can offer strategic insights for investors. Let’s examine the implications of a low VIX in each context.
VIX as a Sentiment Indicator
The VIX measures the expected volatility in the S&P 500 over the coming month, offering a real-time glimpse into how investors feel about market stability or risk. It essentially captures market sentiment, acting as a proxy for investor confidence or worry about future price movements. When the VIX is high, investors are often hedging against market downturns, suggesting that uncertainty or fear is on the rise. In contrast, a low VIX indicates fewer market participants are hedging, suggesting a calmer environment or higher confidence in the trend.
However, interpreting a low VIX requires nuance. In a bull market, a low VIX could signal confidence as investors feel secure, often resulting in fewer downside protections like options or puts. In bear markets, though, a low VIX may indicate apathy rather than confidence, as prolonged market downturns lead investors to stop hedging, either out of fatigue or a “wait and see” approach.
This distinction is crucial: a low VIX doesn’t automatically mean “no fear.” Instead, it reveals different types of sentiment based on the underlying market conditions.
Low VIX in a Bull Market – Calm Confidence or Greed?
In an established bull market, a lower VIX is typically associated with investor confidence. As stock prices rise, the market experiences less volatility, creating a sense of security among investors. This comfort often leads to a reduction in hedging, with fewer put options purchased, which keeps the VIX low.
For instance, when market conditions are favorable, investors are more willing to increase their long positions without much concern for potential downturns. This lack of fear is not necessarily complacency; rather, it could be seen as a “calm confidence,” where investors trust the upward momentum. However, when this sentiment is sustained, it can eventually give way to greed. In such cases, the low VIX can signify that investors are overly optimistic, piling into positions with little downside protection, which could increase vulnerability if market conditions shift unexpectedly.
In a bull market, therefore, a low VIX can represent either healthy confidence or, in more extreme cases, a sign of overconfidence and greed, hinting that a correction might be due if the market overheats.
Low VIX in a Bear Market – A Potentially Subtle Form of Fear
In bear markets, a low VIX reflects a different type of sentiment. Initially, when prices begin to fall, the VIX often spikes as investors buy puts and hedge their positions against further losses. However, if the downtrend is prolonged, the VIX may start to decline as fewer investors engage in hedging activities. This decline doesn’t suggest renewed optimism but rather a subtle form of fear that’s unique to bear markets.
Over time, investors might become fatigued or desensitized to the ongoing losses, choosing to avoid further protection measures due to limited confidence in an imminent recovery. The low VIX in this context reflects apathy or resignation — investors aren’t challenging the trend but are instead waiting on the sidelines or reducing their market participation. This phase, often marked by low trading volume and reduced resistance, can signal capitulation. In such cases, a low VIX doesn’t mean a lack of fear but rather a quiet acceptance of the bear trend.
Implications for Trend Reversals
The dynamics of the VIX in both bull and bear markets can be significant when considering potential trend reversals. A low VIX in either type of market might indicate the extremes of sentiment, which sometimes precede reversals. In bull markets, an extended low VIX level can reflect excessive optimism, where the market is “overdue” for a pullback or correction. This often happens because investors may be underestimating risks, leading to a fragile environment where any negative shock could destabilize confidence.
In bear markets, a declining VIX could suggest that the selling pressure has eased, as fewer participants are hedging against further losses. This can hint at a potential reversal if buyers start to re-emerge and sellers are exhausted. Thus, watching VIX trends during prolonged market phases can provide insights into when a trend might lose momentum and signal a shift.
Summary of Insights from Market History
• In bull markets: Low VIX can reflect greed or confidence, as seen pre-2008 and during the late 2020 rally. Low VIX in these cases suggests investor complacency
Keep reading with a 7-day free trial
Subscribe to Craving Alpha to keep reading this post and get 7 days of free access to the full post archives.


